|
Applications
Fodar™ has many possible applications, here we outline just a few. If you are unfamiliar with DEMs, orthophotos, difference images, and Fodar™, you might want to see this Fodar™ tutorial first. Please contact us with your ideas or questions.
All of the projects shown below were planned, acquired, and processed by Fairbanks Fodar.
Click on a link below to skip to that Application:
Mining
Snow Thickness
Coastal Erosion
Ground Subsidence
Geomorphology
Glaciers
Sea Ice
Infrastructure Monitoring
Construction Progress
Wildlife
Forestry
Mining
Mining operations actively change the shape of the earth on a regular basis. Fodar™ maps can measure cut and fill volumes,
form base maps for planning, document reclamation, detect uncontrolled mass movements before they occur, monitor dam integrity, track assets, and any other use where the shape of the land (or anything on it) is a variable.
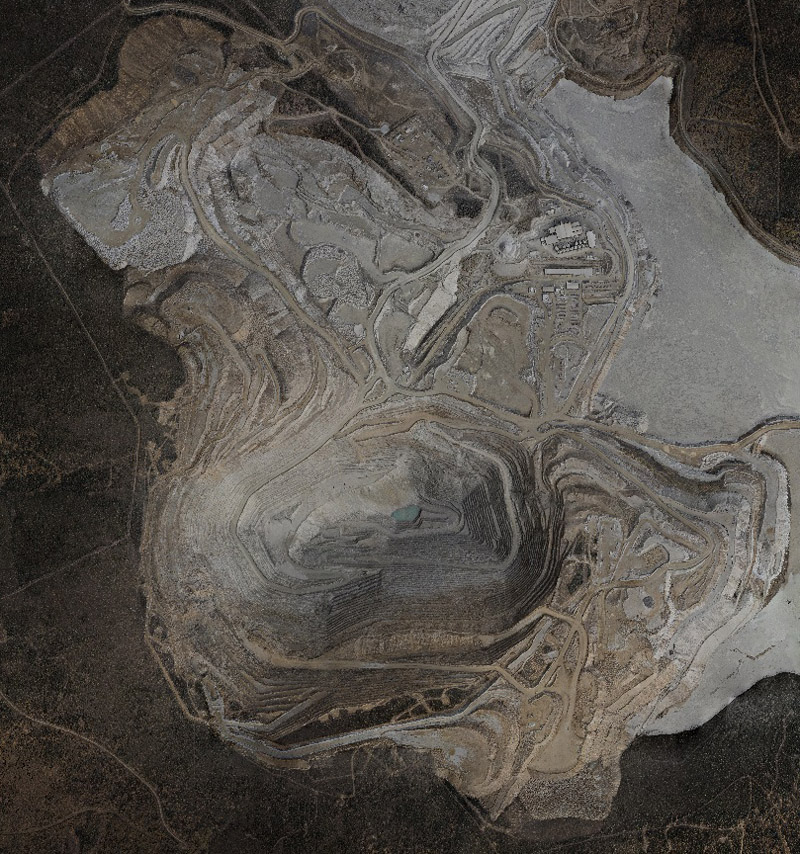
We can easily detect where all mining activity has occurred in the past week using the difference image. Mouse-over this top view -- red means the surface increased in elevation, blue means it decreased, and green means no change. Imagine making a map like this once a week, or even once a day.
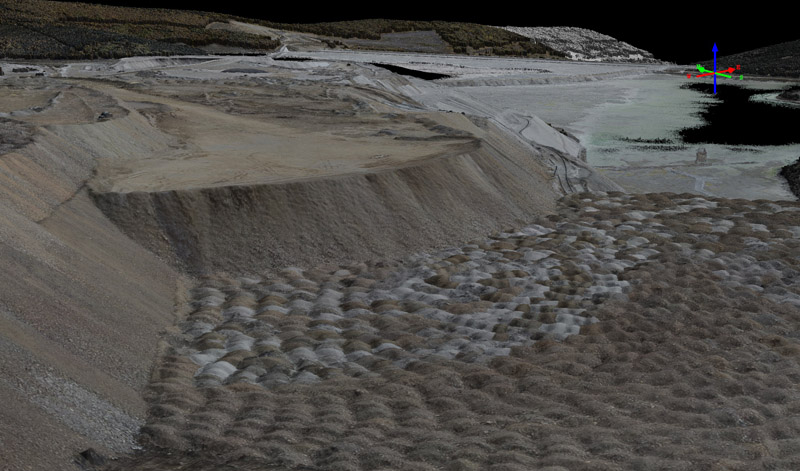
Mouse-over this image to see the tailings pile grow over a week. Those are individual dump loads in the foreground. This pile is in the lower-right of the previous image showing the top view of the mine site, and appearing as a bright red horsehoe.
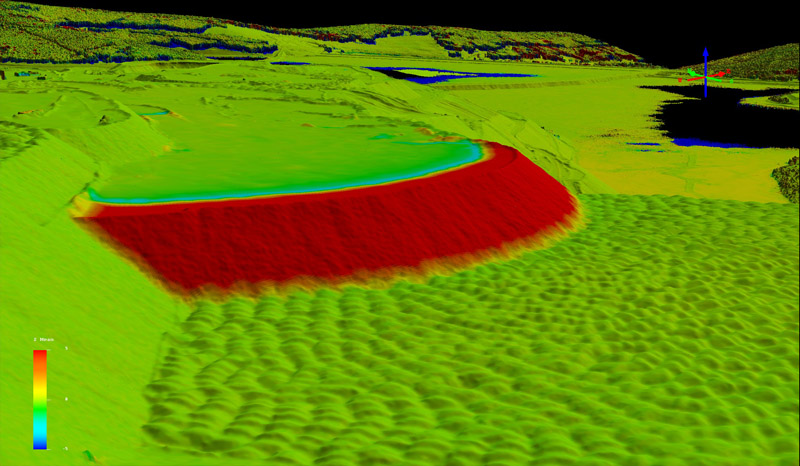
Here is that same tailing pile, shown as a difference image over one week. All of the red tailings here were added during this week; everything in green is unchanged. Mouse-over to see the orthoimage.
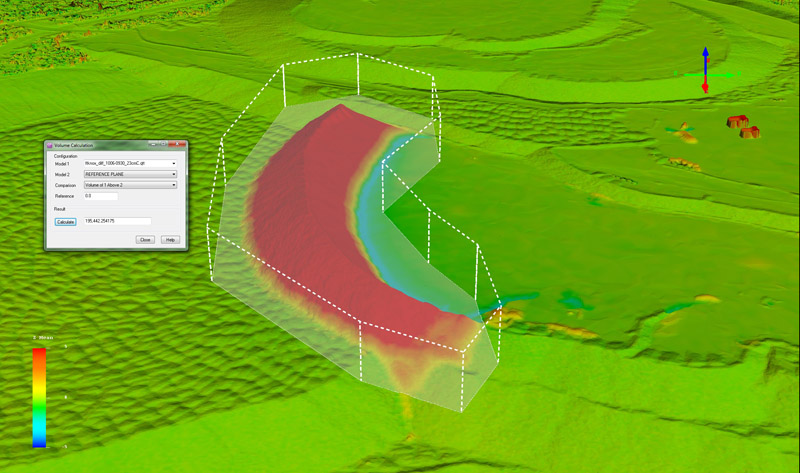
We can easily measure the volume of these tailings, simply by outlining it and pressing a single button. Note the trucks in the upper right are imaged topographically -- they are red because they were not parked there the week before. Imagine measure cut and fill volume weekly or daily with the accuracy of Fodar™.
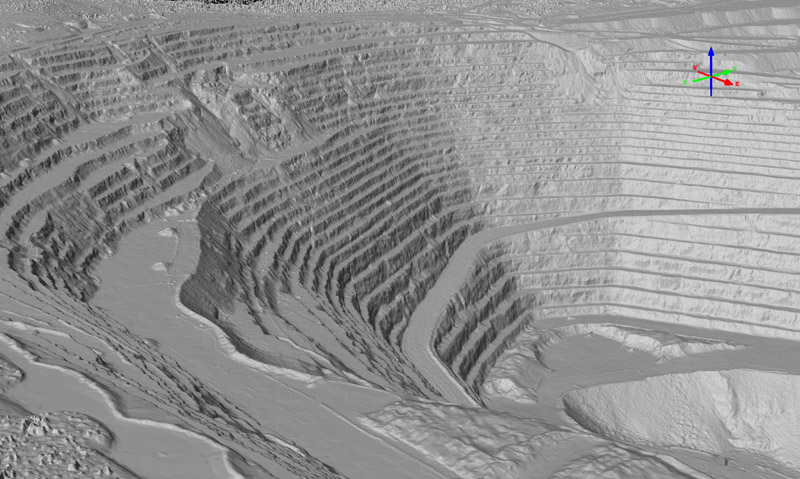
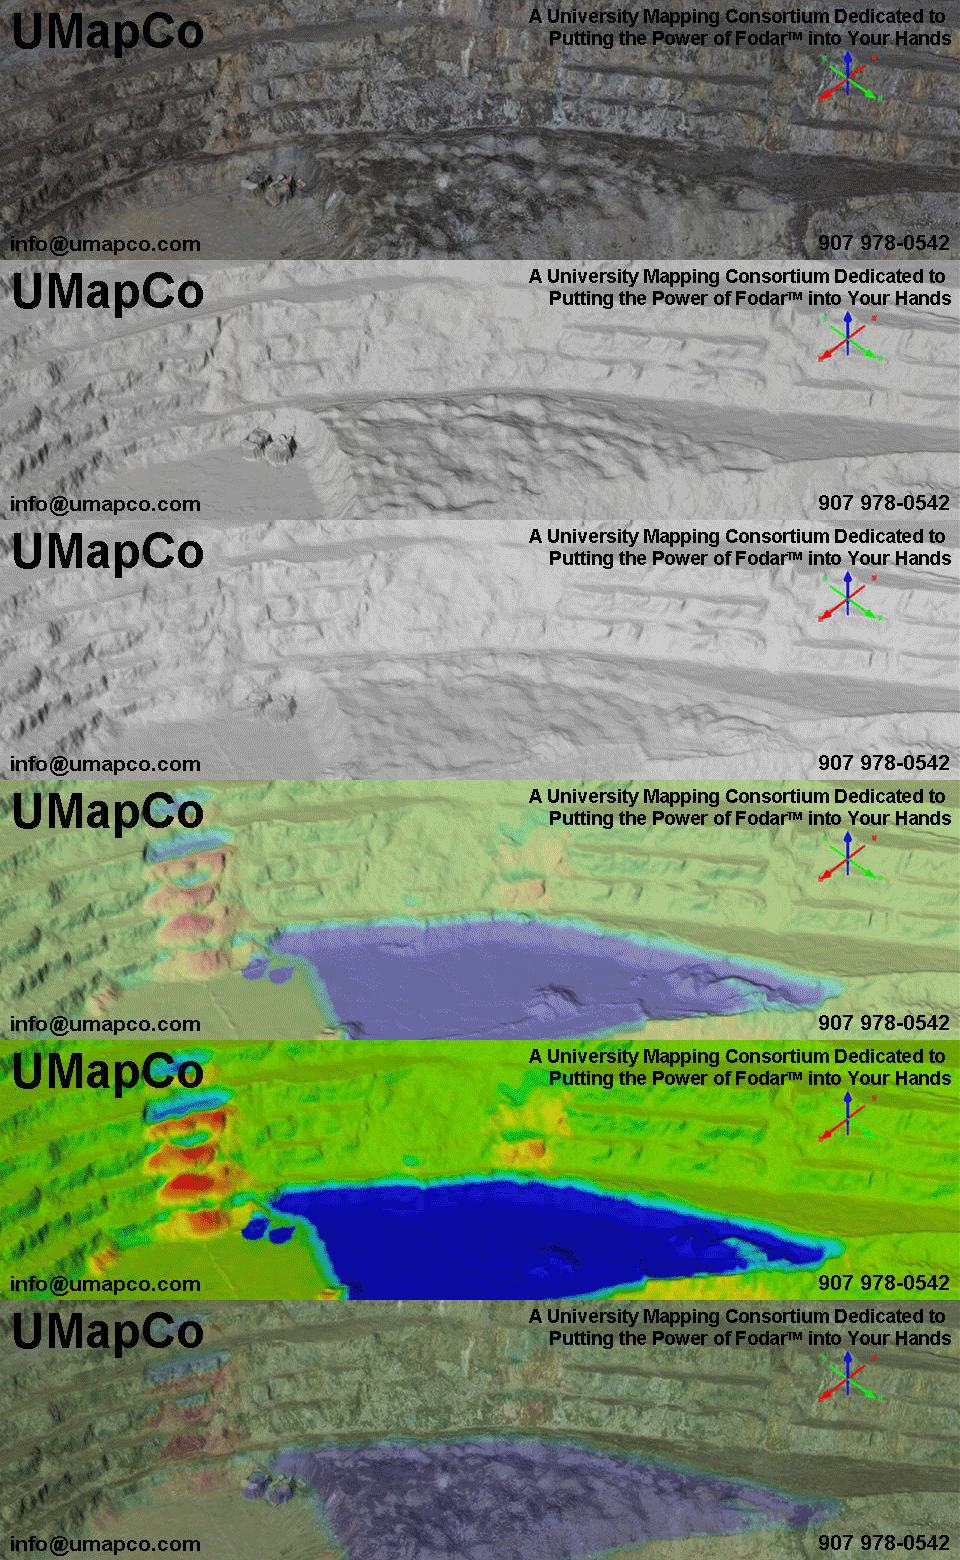
Here an uncontrolled mass movement occurred. You can see the fault trace to the left of center of the image. Mouse-over to see the aftermath of the fault release. You can also see the results of a blast field at left and the results of excavations in the bottom of the pit. Note how the remainder of the pit walls appear stationary -- the lack of motion when flickering between the two images is a sign of the awesome repeatability of Fodar™. Exact volumes of detached material and necessary clean-up can be measured the same day as the detachment using Fodar™.
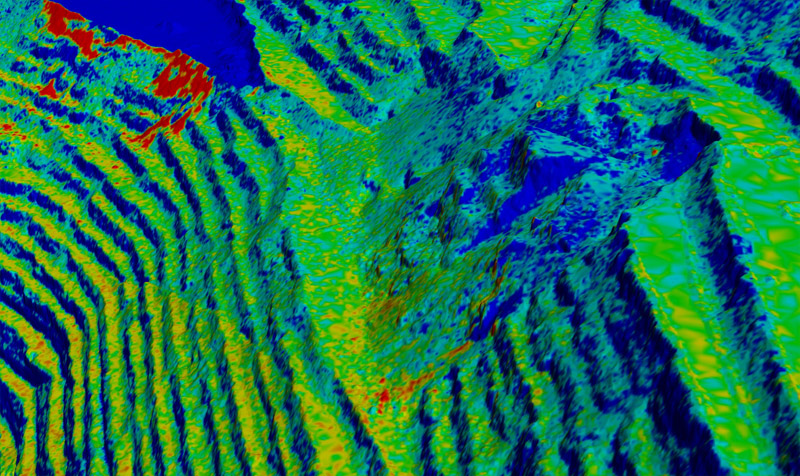
Fodar™ can be used to detect fault releases before they occur. Here is a difference image made from DEMs a week apart. You can see subtle motion on the order of centimeters below the fault trace at lower left. Mouse-over to see a difference image after that fault failed.
Snow Thickness
Seasonal snow is the largest topographic change on our planet, yet until now our ability to measure it has remained elusive. Snow plays a major role in water resources, ecology, and global weather. Fodar™ can measure snow packs as thin as 10 cm over terrain of any roughness or smoothness. The method is to make a map during snow-free conditions and then subtract this from one made during snow-covered conditions.
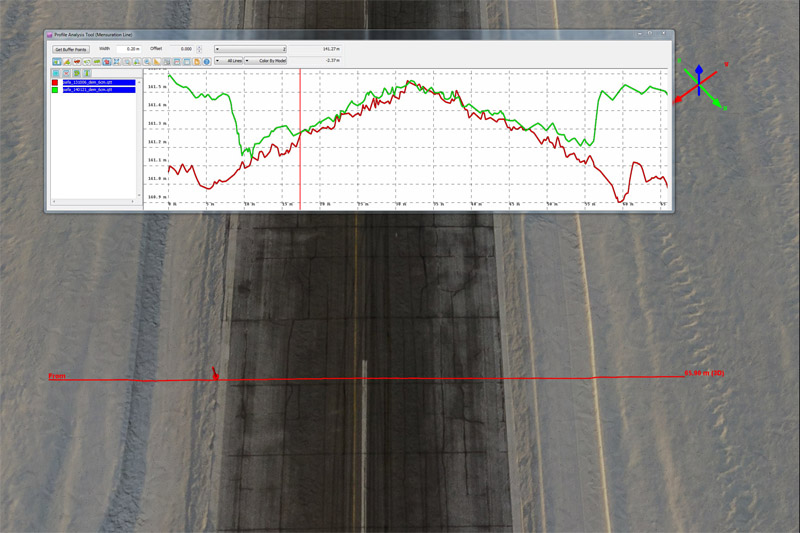
Here is a section of airport runway. The inset plot shows a transect going across and shows elevations from summer (red) and winter (green) maps. Mouse-over to see the summer image.
The vertical ticks are 10 cm, showing that on the plowed tarmac, correspondence between maps was within a few centimeters, easily resolving the 40 cm snow berms. Now imagine a Fodar™ map like this of the entire airport, or city, or watershed.
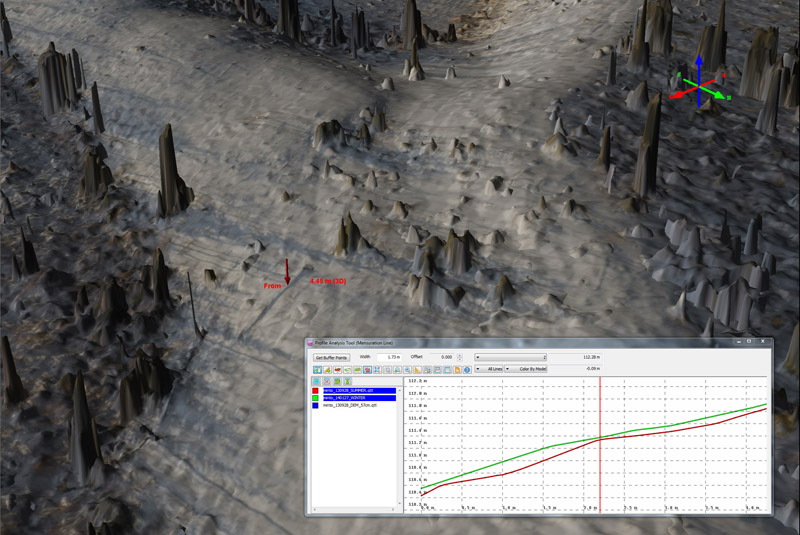
Here is a forested area with standing and dead trees. Mouse-over to see the same area in summer. The plot shows a transect that runs over a dead tree, with summer in red, winter in green, and vertical ticks at 20 cm. About 5 cm of snow overlays the tree, who's shadow can be seen in the winter image and emphasizes the awesome repeatibility of Fodar™ maps.
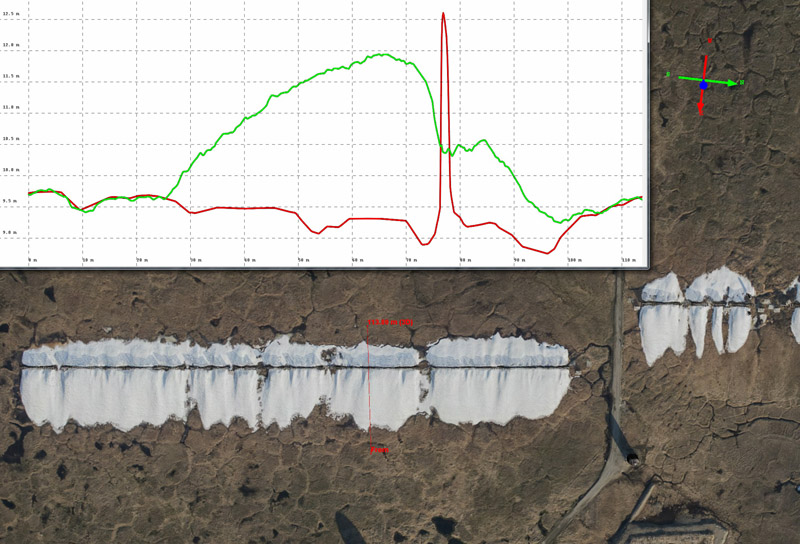
Here are snow drifts formed by a snow fence on Barter Island in winter, in early July before the drifts fully melted. Mouse-over to see it completely snow free in early September.
In the inset, the green line is winter, the red line is summer, vertical ticks are 1 meter, and horizontal ticks are 10 m. Note how the snow free ground matches within +/5 cm and that you can see a smooth ramp of snow at the centimeter level. The fence doesnt show up in the winter image as it was acquired at lower resolution. Note thermal subsidence of the ground in the snow-free image, caused by the snow drifts.
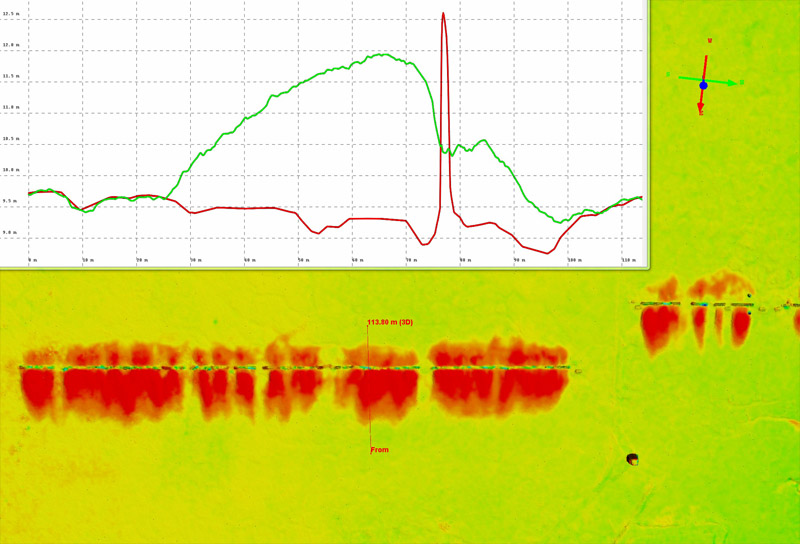
Here is the same area as above, but this time as a difference image between July and September. The yellow-green color means no change, and red is up to 2.5 meters of change. Mouse-over to see the July image. Snow of essentially any thickness can be using Fodar™, whether its in the Arctic or in the Sierras.
Coastal Erosion
Coastal erosion rates are changing due to global climate change, but exactly how remains to be seen. Fodar™ can measure not only the aftermath of storms, but the aftermath of yesterday's high tide. It can accurately map beach and inland topography for storm-surge and tsunami modeling, and the erosion and debris in the topography and orthoimage can be used determine the high tide limits.
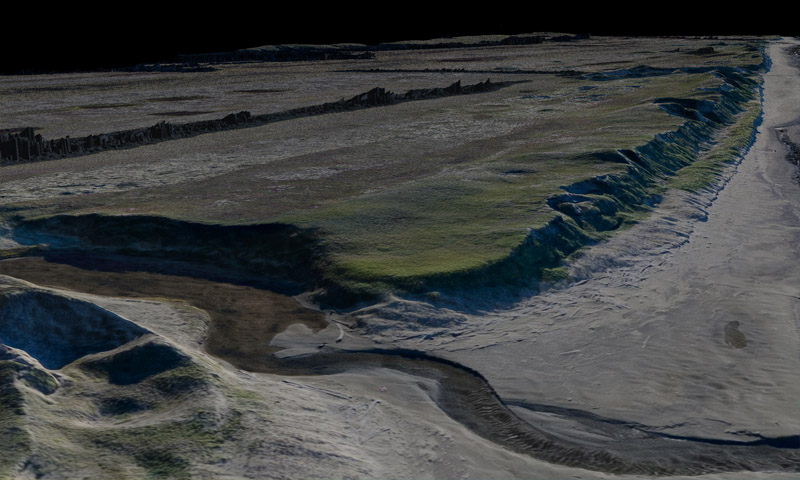
Here is the coastline of Cape Espenburg. The ice rich ground thaws in summer and slumps onto the beach. Mouse over to see colorized topography, which clearly shows how the tide is eroding the material slumping onto the beach, defined by the transition from green to blue. Note how this color transition stays constant all the way into the distance, as it should because it defines a constant sea-level height. This is massive ground control confirm the precision of Fodar™.
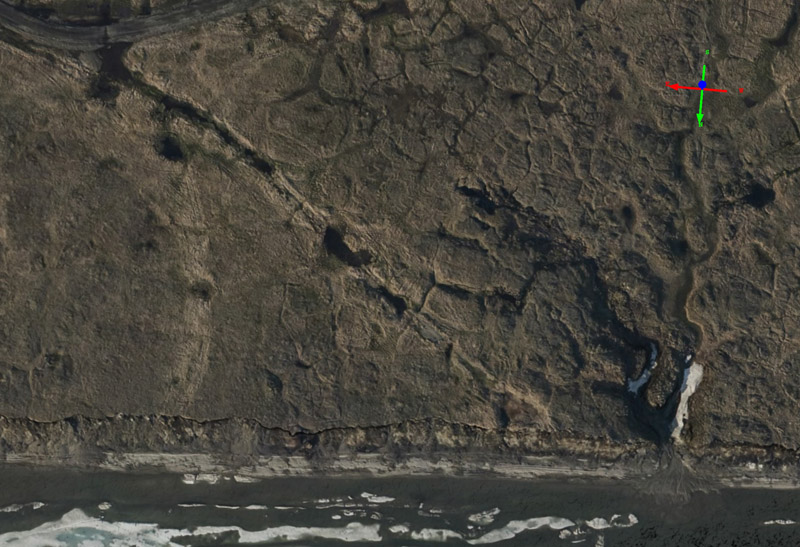
Here is the coastline of Barter Island in July. Mouse over to see it in September. Note the erosion of the bluffs at bottom. Also, you can see a road wash-out repaired with a culvert at upper left. The apparent misalignment between images is caused by the difference in shadow direction; put your finger on a feature and flicker to verify.
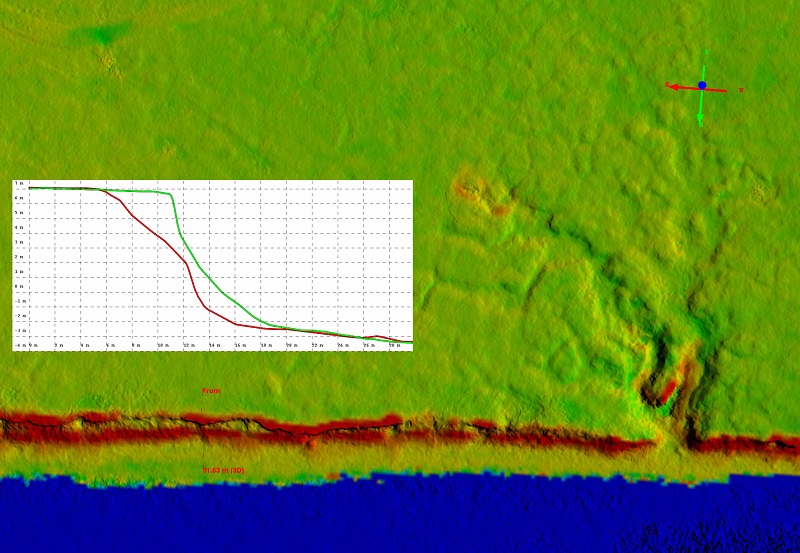
Here is the same area as above but as a difference image. The yellow-green color means no change, red is up to 2.5 meters. Mouse-over to see the July image. The bright red areas along the coast are where the bluffs fell into the ocean. The inset shows a transect of elevations from the bluff to the water, where green is September topography, red is July topography, vertical ticks are 1 meter and horizontal ticks are 2 meters. Note the bluff-surface and beach match to within +/- 5 cm. The headwalls are steeper in July because they are frozen, once they start to melt they slump off, and the toe is washed away by waves. Note also the roadwork in upper left and the thermal erosion of the gully at right.
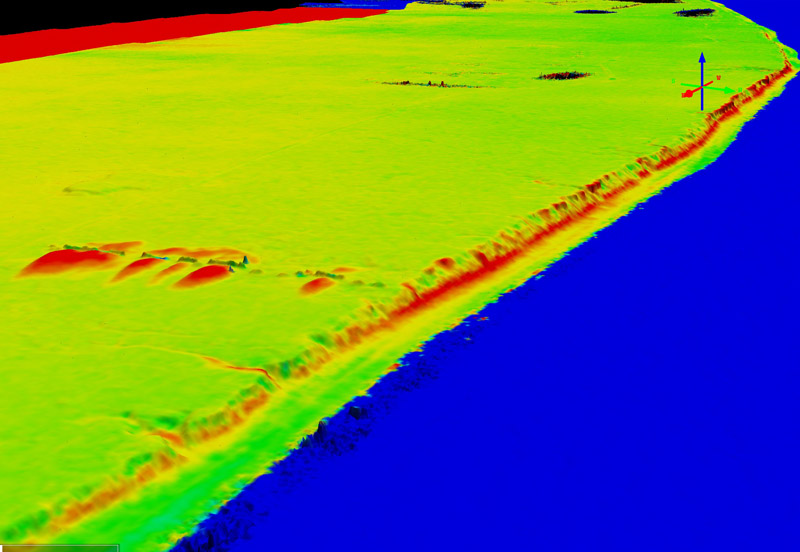
Here is another view of the coastline as a difference image. The main point here is that the tundra surface and surf line show no change -- no ramps or warps existed in either of the Fodar™ DEMs used to make this difference image. Mouse-over to see the July image. Whether coastal erosion or erosion by some other process, Fodar™ can detect change at the centimeter level as often as the situation requires.
Ground subsidence
Whether caused by thermal instability of permafrost, pumping of subterranean acquifers, or some other geomorphic process, subsidence is a big deal. Even a few centimeters of change can be detected with Fodar™.
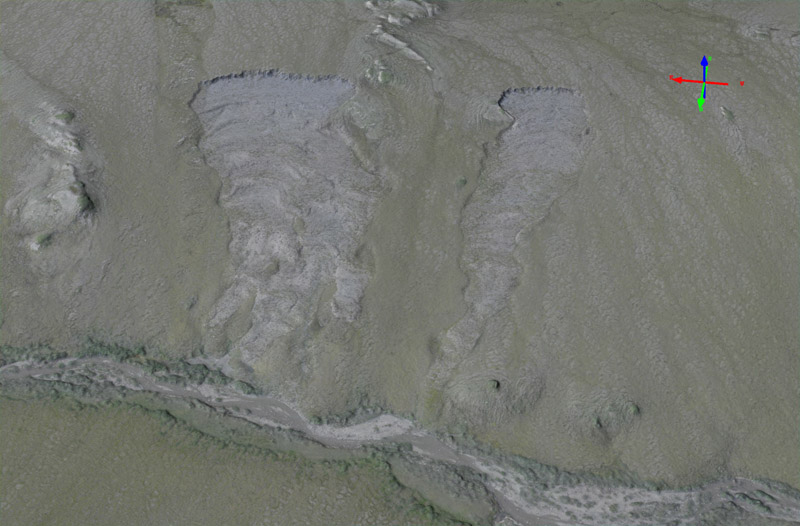
Here are some thermokarst slumps in the Noatak River valley. Mouse-over to see the change over 1 year. Ice rich ground beneath the tundra melt, causing the ground above to subside and flow downhill towards the stream.
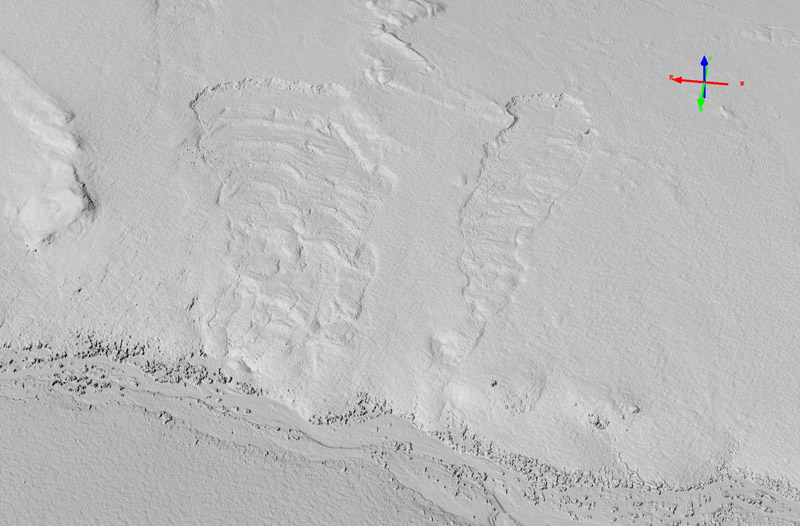
Here is a shaded relief of the same slumps. Mouse-over to see the terrain over 1 year. The headwalls here are about 2-3 meters high and they migrated about 10 meters. The difference in acquisition resolutions causes differences in feature appearance, but does not adversely affect the precision of the results.
Geomorphology
Fodar can detect subtle, natural changes in the earth's surface. River geomorphology is just one application.
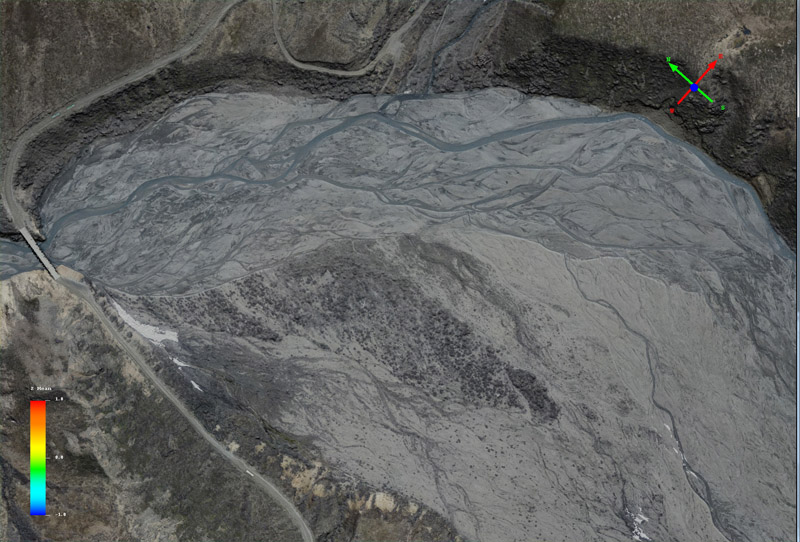
Here is a section of the Toklat River in Denali National Park in early June. Mouse-over to see the same area in late August. Note that the position of the river and its braids has changed considerably.
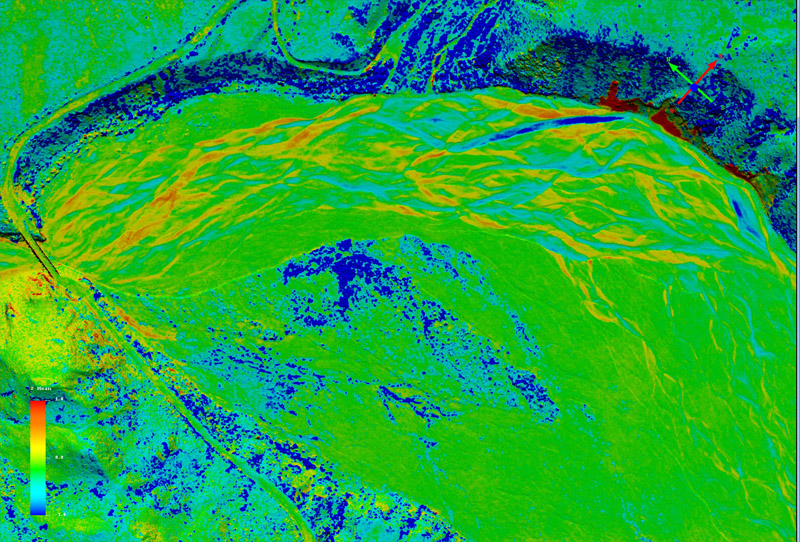
Here is the same area, this time as a difference image of elevations. These are direct measurements of change in topography caused by stream channel migration, deposition, and erosion. Note that Fodar does not measure the height of water accurately, so some care is needed to distinguish apparent elevation change corresponding to the water bodies themselves, and much of the change seen here is over either old or new water channels, as seen in the mouse-over. Most of the dark blue is shrub growth.
Glaciers
As climate continues to warm, glaciers continue to lose volume at an increasingly rapid rate. Fodar™ is an excellent tool for the measurement of glacier change on annual, seasonal, and even daily time-scales and its orthos can be used for feature tracking to determine velocity fields.
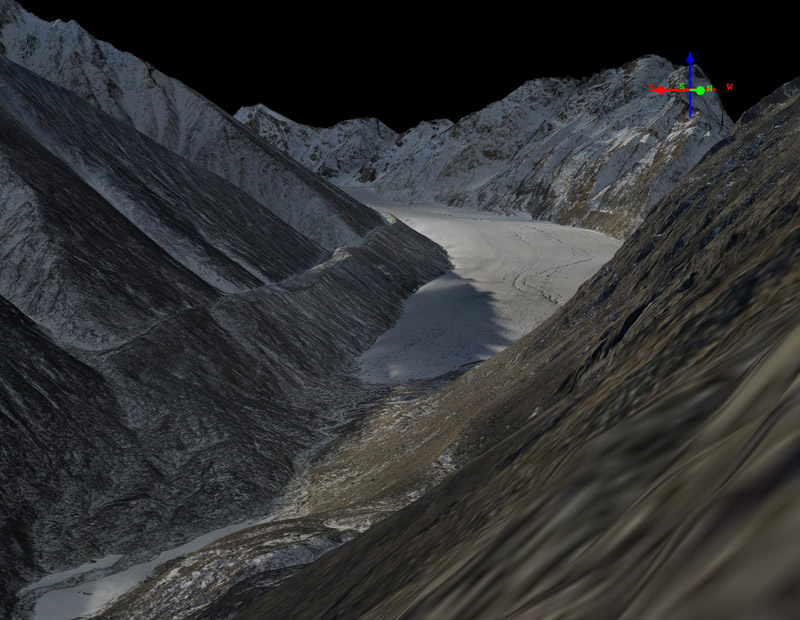
Here is McCall Glacier in the eastern Brooks Range of Alaska in 2013. Mouse-over to see the changes that have occurred over 5 years, compared to a 2008 lidar DEM. Here light blue means no change and red means surface lowering.
Sea Ice
Sea ice plays an enormous role in global climate dynamics and ocean commerce, yet our understanding of it is limited by our observational methods. Fodar™ can measure freeboard, surface roughness, and dynamic change for both scientific and navigational uses.
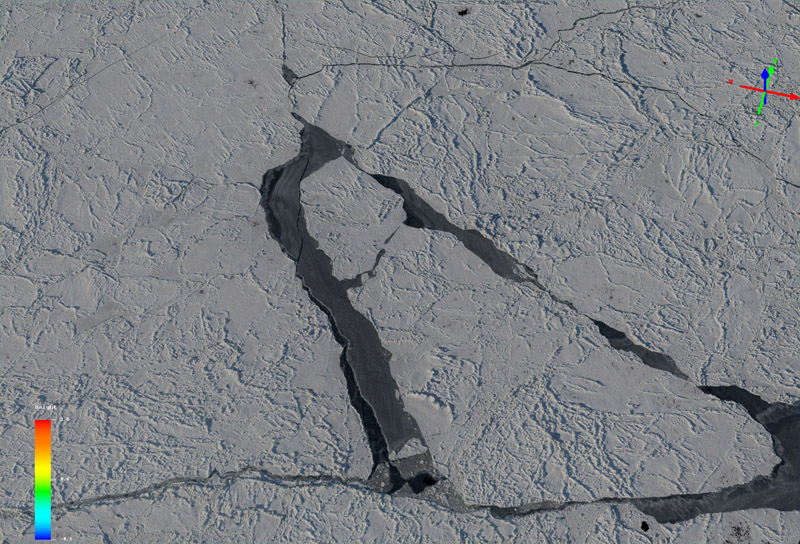
Here newly-formed leads in sea ice are freezing over. Mouse-over to see colorized 'terrain'. The relief here is tiny -- the colors stretch over less than 2 m elevation. This is one of the most challenging photogrammetric environments, yet the results speak for themselves. Note that the open water and new ice are all at the same elevation, as denoted by them being the same color.
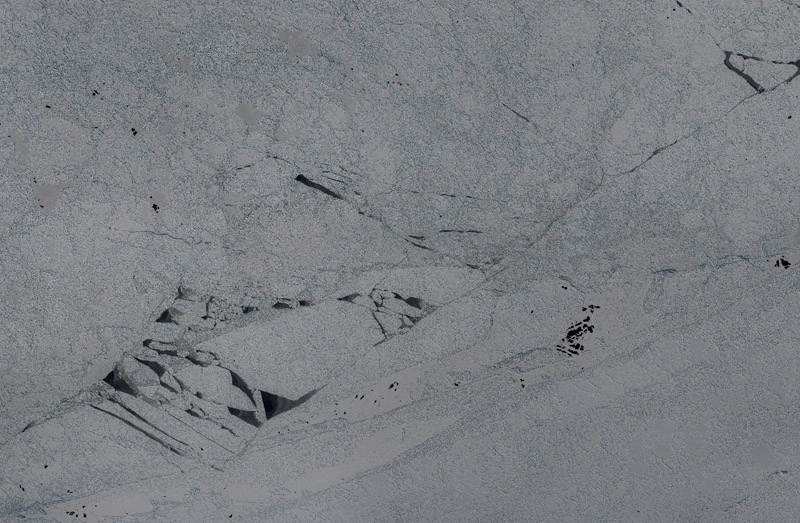
Here landfast ice comes in contact with moving ice, creating leads and rotating blocks. Mouse-over to see colorized terrain.
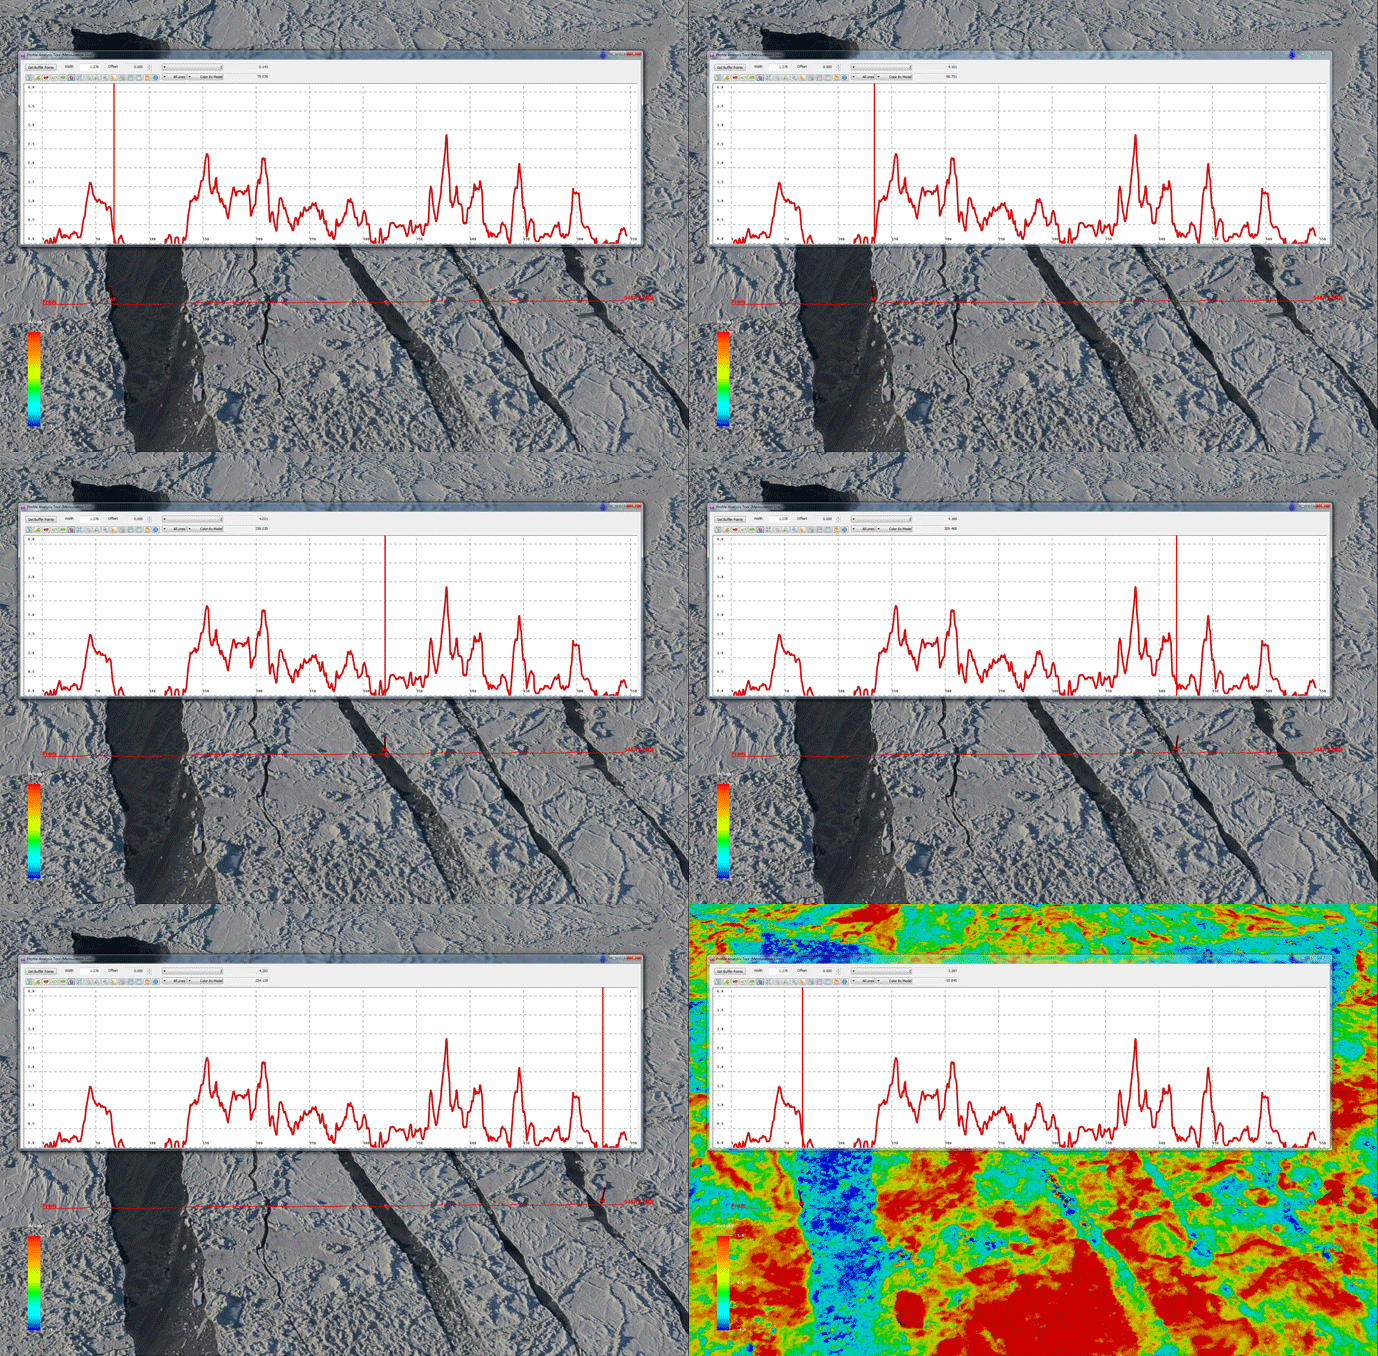
In this animated gif, the pointer moves between several leads, right at the water's edge, demonstrating that sea-level is constant across the scene.
Infrastructure Monitoring
All runways, roads, bridges, and buildings are in some state of decay. Fodar™ can detect and measure changes in surface elevation as part of a systematic, operational program to detect such changes before they become expensive to fix or cause major surprises.
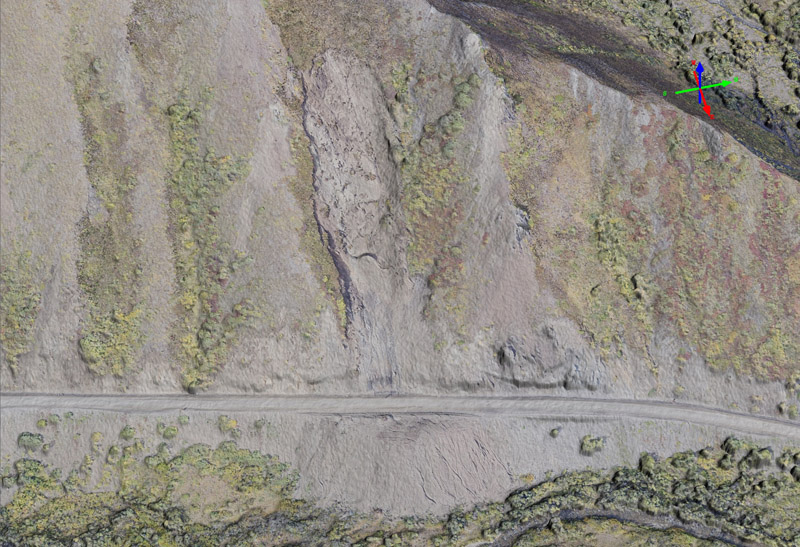
Here a small landslide covered the road into Denali Park in 2013. A year later, there is still motion and small detachments occurring. Mouse-over the image to see where change is occurring between June and August of 2014. Red colors mean that surface dropped over that time, blue means the surface raised.
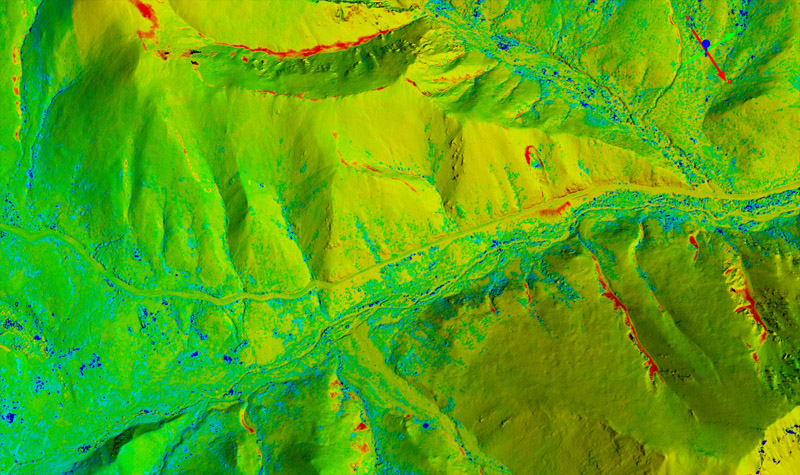
Here is the same valley as above, with the slide left of center. By differencing two Fodar™ DEMs, you can see at a glance where any changes have occurred. Except for the slide, all of the areas of major change here are due to snowmelt. Without an associated orthoimage (like Fodar™ provides), it would be difficult to interpret these changes as snowmelt. Mouse-over to see the image and its snow.
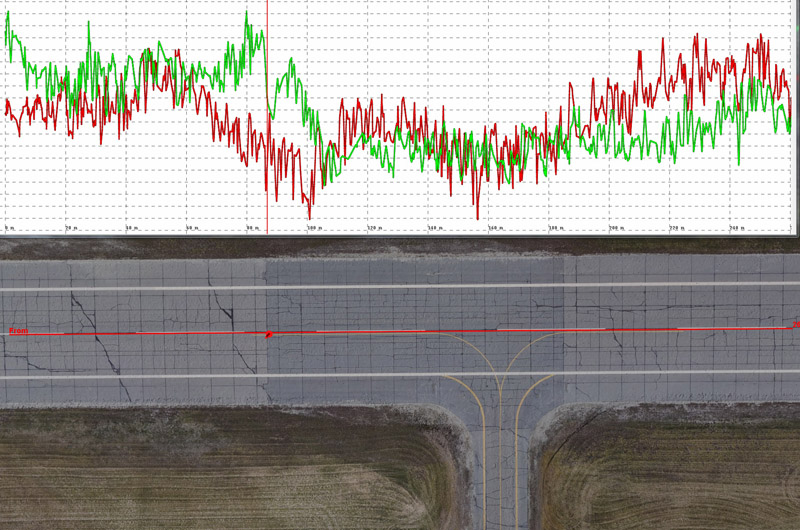
Here the tarmac of a runway has been repaired, as seen by the slightly darker color. The inset plot shows runway elevations in October (red) and January (green), with vertical ticks at one (1) centimeter. The vertical line in the inset is at the connection between new and old tarmac and shows no movement there. On either side of this weld, however, there is up to 10 cm of motion. Fodar™ can detect such subtle changes due to frost heave or other mechanisms on runways, roads, or bridges, identifying issues before they become problems.
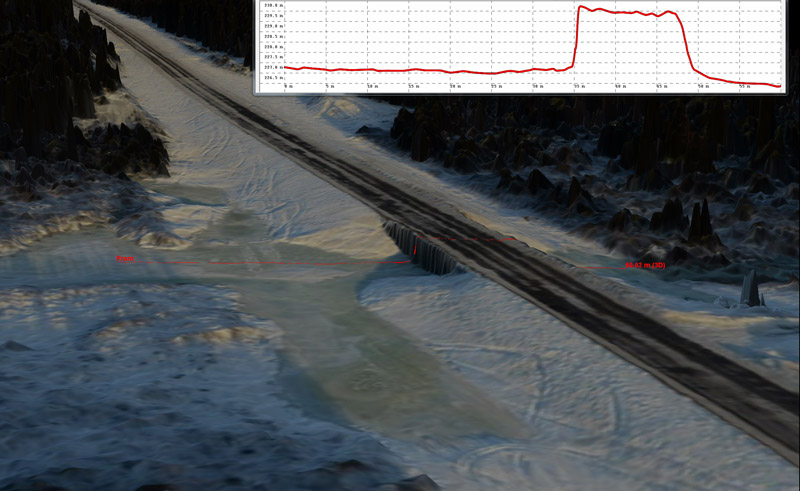
Here is a view looking at the downstream side of a bridge and culvert system in Fairbanks, showing it being overrun by aufeis in winter. When the snow begins to melt,
the culverts are clogged with ice and water is impounded on the upstream side of the bridge, seeking its own means of escape downstream. Fodar can measure the thickness of this aufeis by subtracting an ice-free map from it, similar to measuring snow melt. Knowing which culverts are clogged at the beginning of spring can help focus remedial efforts.
Construction Progress
For about the same cost as making oblique photos of construction progress, Fodar™ can made DEMs and orthophotos that can be used for engineering, permitting or compliance. Fodar™ can also be used for asset tracking.
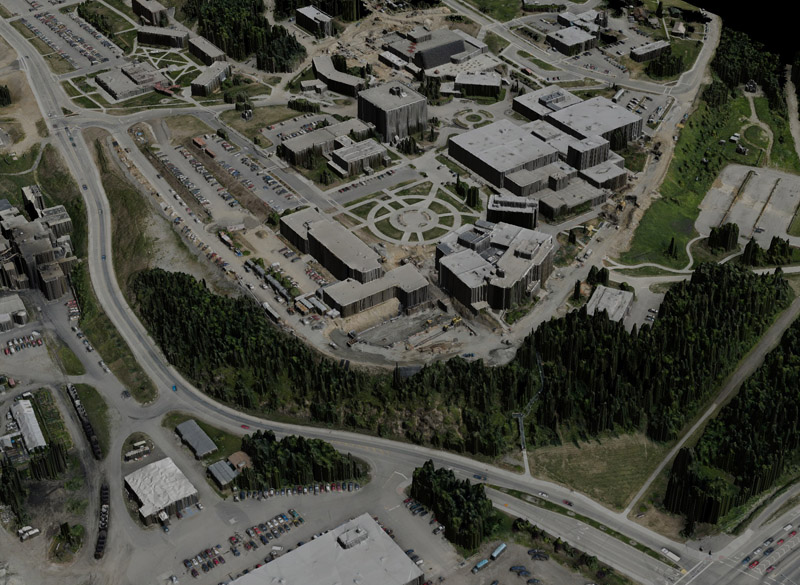
Rather than simply creating a time-series of photos of contruction progress, Fodar™ can measure the topography of construction progress. Here a new building is being constructed at UAF. Mouse-over to see colorized topography.
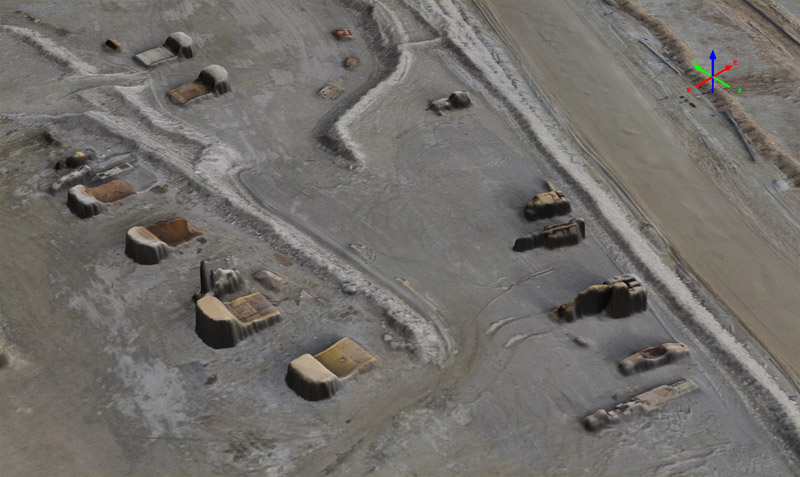
Here are some truck beds and drill rigs at a mine site. Mouse-over to see which of them were moved in the past week. Blues and dark greens means an asset was moved away, yellows and reds mean that something was added.
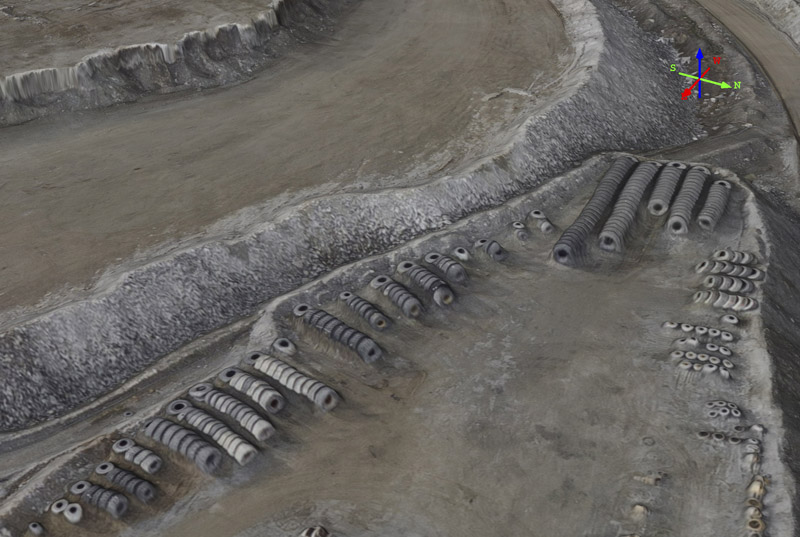 Here are some truck tires at a mine site. Mouse-over to see which of them have moved. At a glance, Fodar™ difference images like these can be used to identify changes in even the smallest of ground-assets. Here are some truck tires at a mine site. Mouse-over to see which of them have moved. At a glance, Fodar™ difference images like these can be used to identify changes in even the smallest of ground-assets.
Wildlife
Anything on the earth's surface is topography to Fodar™, including caribou and their footprints.
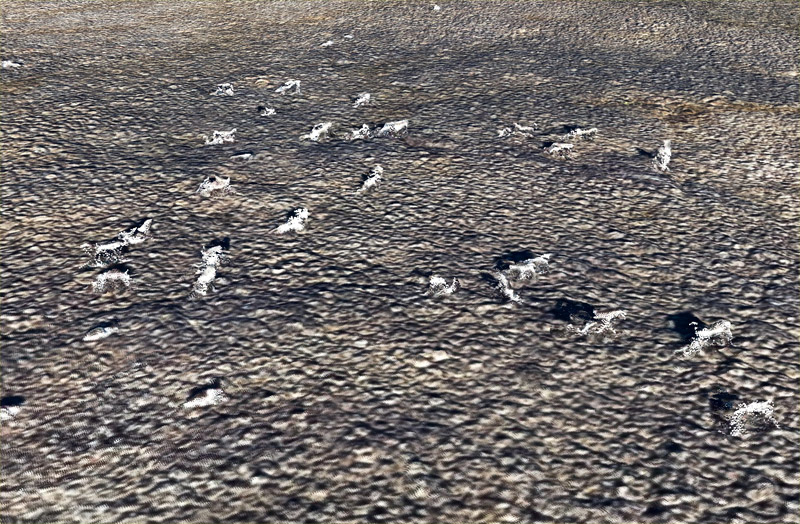
Here are some caribou grazing on the tundra, as seen in a point cloud (rather than the DEMs in previous images). Mouse-over to see them isolated from the terrain for numerical analyses. Note that you can see their antlers. During winter, we can track where animals have been by their footprints in snow, and take good guesses at their numbers and activities.
Forestry
Fodar™ DEMs, orthos, and point clouds can be used to determine stems per acre, species, and height, can assist in layout and permitting before sale and can create bald earth maps, assist with reprod and pct, and monitor time until harvest after sale. Here are several movies made by synthetically flying over Fodar™ point clouds of forests. Fodar™ uses proprietary methodologies for achieving point densities in forests that rival lidar, but have the benefit of being in color and affordable.
|